New Whitepaper Explores the Connection between Soil Health and Water Quality
This article was originally published on the North Central Region Water Network's Blog on April 27, 2023.
Two Soil Health Nexus members, Francisco Arriaga, Associate Professor and Extension Specialist at the University of Wisconsin-Madison, and Anna Cates, Assistant Professor and State Soil Health Specialist at the University of Minnesota, recently published a long-awaited whitepaper exploring the connection between soil health and water quality.
“While there has been a lot of work linking farm management practices with soil health or water quality, few have looked at the connection to both soil and water quality,” notes Cates. “Generally, management systems that lead to better soil health result in decreased risk to water quality, but that is not the case in all conditions or for all management systems. What works in one field for both soil health and water quality might not be the best option for another field. This whitepaper explores those intricacies so educators can better recognize and communicate when the relationship isn’t positively correlated.”
The 10-page whitepaper outlines those situations where soil health best management practices don’t improve water quality, for example when high water infiltration capacity in soil with limited depth to bedrock can lead to rapid delivery of nutrients to groundwater or when no-tillage practices can result in more runoff and overall phosphorus losses from frozen sloping fields relative to fall chiseling.
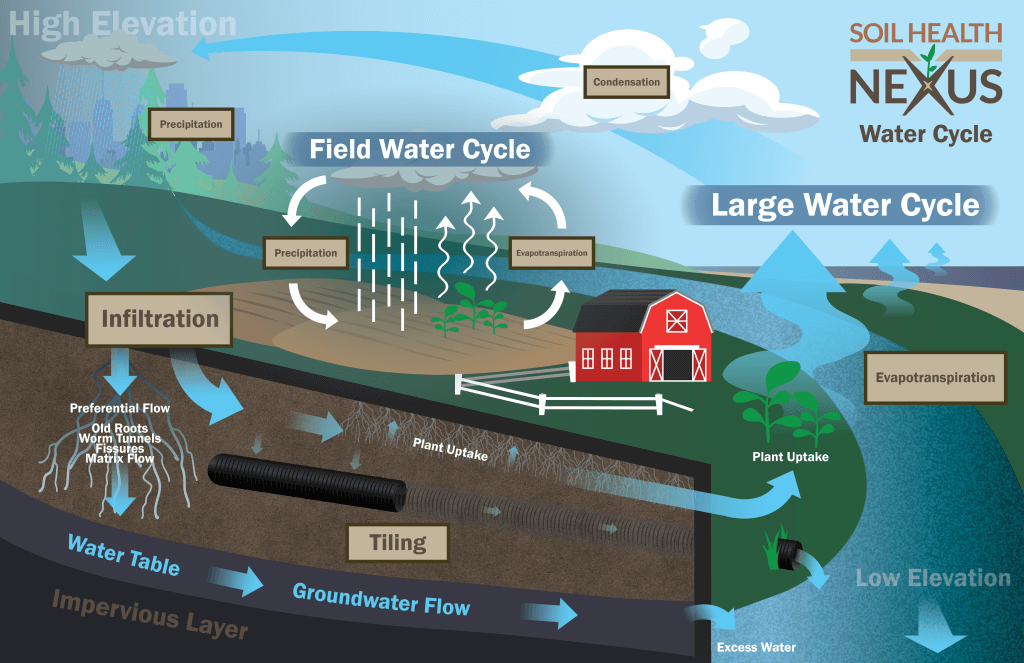
The whitepaper also includes numerous diagrams and pictures to illustrate the complex relationship between soil health and water quality and includes a table outlining soil health properties and their relative impact on water quality – an easy-to-use reference guide and resource for educators. Included in the whitepaper are two newly designed graphics visually depicting the water cycle and the nitrogen cycle.
This article was reviewed by Leslie Johnson