Groundwater Nitrate in Nebraska: Key Factors and Timescales of Movement
Factors Influencing Groundwater Nitrate Concentrations
Recent nitrate-N levels in groundwater are the result of several factors. Key factors include land use, the amount and timing of precipitation and irrigation water applied, subsurface conditions (including soils and geology), distance from ground surface to the water table (vadose zone thickness), and depth of the well. These factor vary significantly across Nebraska, as demonstrated by maps in the figure below. Variability increases the complexity and challenge of monitoring and managing nitrate in aquifers and connected surface water bodies.
Land use
Land use for crop production (Ag Fields) depends on soil, typical annual rainfall and/or availability of irrigation water, and other factors such as topography. Application of nitrogen fertilizers is a major source of nitrate-N in soils, vadose zone and in groundwater in Nebraska.
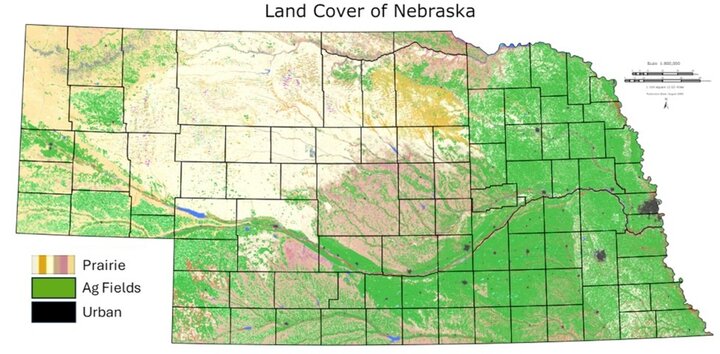
Figure 1. Nebraska Land Cover: UNL CALMIT. High resolution image.
Well density
Well density depends on productivity of the underlying geology (aquifer), suitability of land for row crop production, and other factors including groundwater regulations. Water application combined with unpredictable precipitation events can cause high infiltration rates that carry nitrate downward through the root zone and into the vadose zone and groundwater.
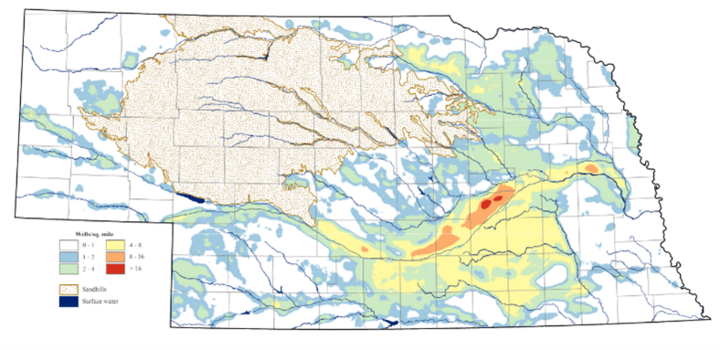
Figure 2. Well density in Nebraska. 2023. UNL CSD based on NDNR data. High resolution image.
Depth to groundwater
Depth to groundwater depends on topography, where groundwater is usually closer to the surface in valleys than in surrounding uplands. Annual rainfall, irrigation use, soils, geology, and irrigation canal operations can also affect depth to groundwater. In general, areas with shallow groundwater and high permeability soils overlying high conductivity geological materials (e.g., sand/gravel) show the most rapid response in groundwater nitrate concentrations to increases or decreases in inputs of nitrogen. In upland areas, or areas where depth to groundwater is greater, the impact of nitrogen on groundwater nitrate concentrations may not be as immediate, but substantial nitrate may be temporarily stored in the vadose zone as it travels downward toward the groundwater.
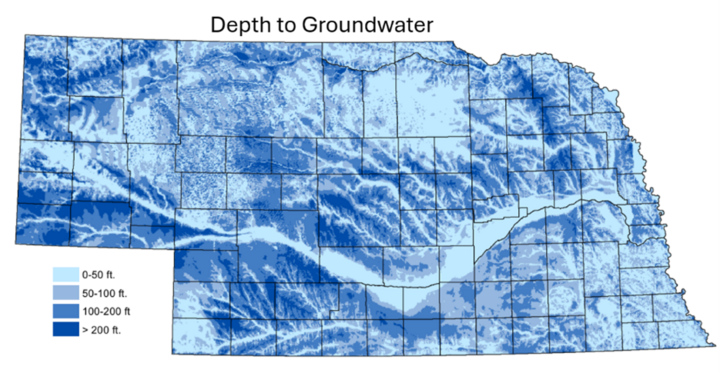
Figure 3. Nebraska generalized depth to groundwater. Nebraska Department of Environment and Energy. 2023. High resolution image.
Key Factors and Timescales of Movement
The timescales for nitrate movement through the subsurface is variable at local and regional levels across Nebraska. McMahon et al. (2006) provide descriptions of fast and slow path scenarios and related timescales for water and chemicals to reach groundwater. The examples in the figure below give an approximate sense of timescales through the vadose zone. Arrows connect to example locations in Nebraska where these timescales may be relevant. Once nitrate reaches the groundwater, it may be present for years, decades, or more, before exiting the aquifer through pumping or discharge into surface water.
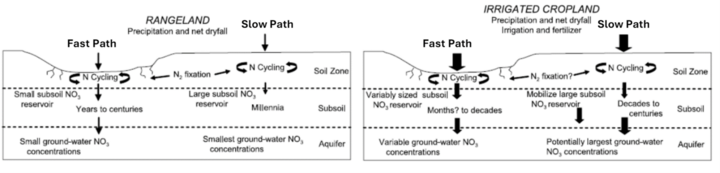
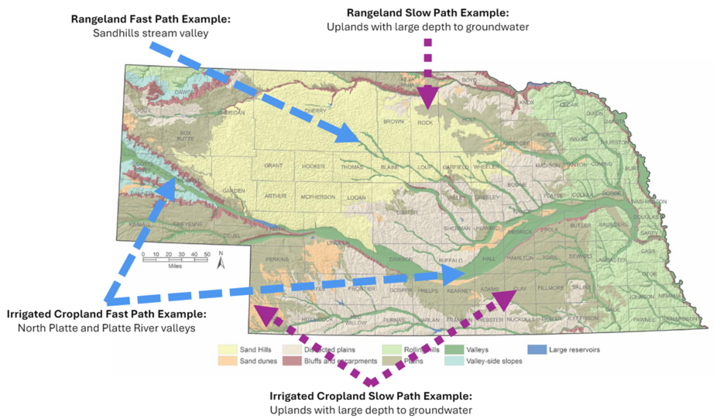
Figure 7. Fast/Slow Path Diagrams Modified From: McMahon, P.B., Dennehy, K.F., Bruce, B.W., Böhlke, J.K., Michel, R.L., Gurdak, J.J., Hurlbut, D.B., 2006. Storage and transit time of chemicals in thick unsaturated zones under rangeland and irrigated cropland, High Plains, United States. Water Resources Research 42.
Most recent nitrate concentrations
The above factors contribute to the most recent groundwater nitrate concentrations. The most accurate way to know your water's nitrate concentration is to test it annually. The following maps are different visualizations of nitrate levels across Nebraska. The first shows actual well results, the second is an average of the wells in each township, and the final is a predicted nitrate level map. These each provide insights to where in the state we are seeing elevated nitrate levels. The EPA safe drinking water threshold is below 10 ppm.
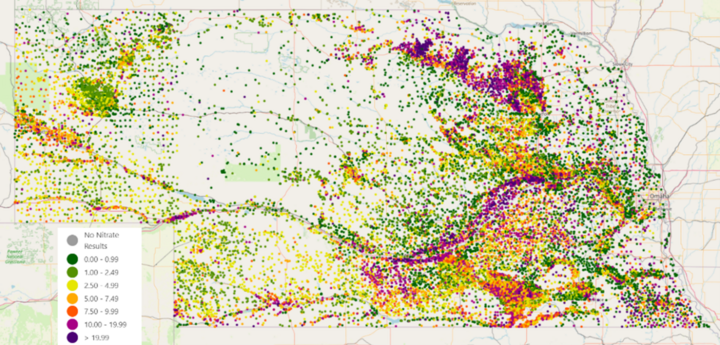
Figure 4. Most recent recorded Nitrate-N concentration of wells from 2003-2024. (Source: Nebraska Groundwater Quality Clearinghouse 2024)
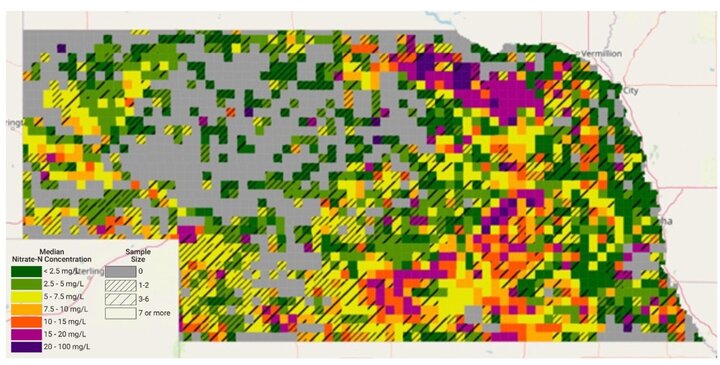
Figure 5. Median of the most recent Nitrate-N concentration by township of 34,043 water wells (all types) during 2000 – 2022. (Source: Nebraska Groundwater Quality Clearinghouse, 2023) Gray areas indicate no data reported, not the absence of nitrate in groundwater.
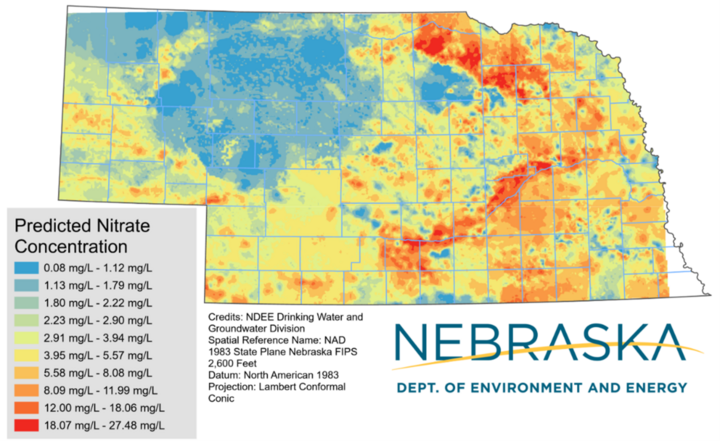
Figure 6. Nebraska Nitrate Hotspots. Nebraska Department of Environment and Energy. 2023. High resolution image.
Other Resources:
Nebraska Vadose Zone information
Groundwater Transit Time interactive map
Why does groundwater nitrate vary so much across Nebraska?
Groundwater Nitrate: Lag times and variability
This article was reviewed by Nawaraj Shrestha