How can nitrogen budgeting estimate nitrate-N loading to groundwater?
Authors:
Daniel N. Miller, USDA-ARS, Agroecosystem Management Research Unit, Lincoln, NE
Daniel D. Snow, University of Nebraska Water Sciences Laboratory, Lincoln, NE
Brian T. Krienke, University of Nebraska Department of Agronomy and Horticulture, Lincoln, NE
Increasing nitrate-N concentrations in groundwater has become a national issue. This problem gained recognition in Nebraska during the 1960’s as associated with fertilizer-N use and irrigation practices, and even now remains largely unresolved because of the complexity and scale of land use. Nitrogen (N) budgeting, where accounting principles are applied to measured quantities of individual N sources, is one tool for understanding how long-term fertilizer-N use and irrigation contributes to this problem. Nitrogen budgeting can be used in developing a framework for N management so that crop production can continue with minimal impact on water quality. Here, we explore this tool by going through commonly-used conversions and calculations for N supply and nitrate-N leaching.
How much nitrogen is in the aquifer?
A commonly accepted practice for estimating nitrate-N applied in 1 ac-ft of irrigation water is to multiply nitrate-N concentration in parts per million (ppm) by 2.72. One ac-ft is 325,851 gallons or about 2,720,000 lb water (one gallon of water weighs 8.34 lb). Therefore, nitrate N pounds applied in 1 ac-ft is the concentration in ppm multiplied by 2.72, and the annual lbs N from irrigation would be calculated by the total ac-ft applied. For example, the average groundwater nitrate-N for the Bazile Groundwater Management Area (BGMA) in north central Nebraska is 17 ppm[1] with considerable variation by location and depth (Figure 1). This represents 17 x 2.72 = 46.2 lb N/ac-ft water. The upper 50 feet of the BGMA aquifer is contaminated with high nitrate water (Figure 1), and the aquifer matrix is water-filled sand and gravel (25% water-filled space). So, if all the water from 1 acre of the 50-foot thick aquifer was pumped aboveground, this would yield an acre-sized pool about 12 feet deep (25% of 50 feet). Therefore, 17 ppm nitrate-N x 2.72 x 12 ac-ft water = 578 lbs of nitrate-N contamination in the aquifer under an acre of BGMA.
Some nitrogen just gets lost
Could this much N really bypass the crop roots and make it into the aquifer? Using the University of Nebraska recommendations[2] for soils and yields in the BGMA, 188 lbs N/ac is a good target rate. The mean recovery for fertilizer-N in grain + stover averages only 67% for corn after corn and 75% for corn after soybean even with best N and irrigation practices, such as side-dressing fertilizer at V6[3]. In other words, 25% to 33% (or more) of the fertilizer-N (47 to 62 lb N) isn’t utilized by the crop. Accounting for N, 220 bu/ac corn has 213 lb N in above ground biomass (148 lb N in grain and 65 lb N in the corn stover) with 126 to 141 lbs N coming from fertilizer. Soil supplies the balance of N (72 to 87 lb) for the crop). A substantial amount of the N coming from soil is recycled crop biomass N from previous years. What happens to the unutilized fertilizer N? It may be lost as a gas (dinitrogen, nitrous oxide, and ammonia), leached, or could be building up in soil organic matter. With less optimized N management, recovery efficiency is lower, and even greater N losses are expected.
Leaching varies, but it can be big
What would be an appropriate estimate of the fertilizer moving into ground water at the BGMA? A very crude N budget for the BGMA aquifer can be estimated by summing the potential inputs and outputs for the aquifer. In this example, we focus on an acre area beneath typical crop production. Three studies[4],[5],[6] show anywhere from 18% to 36% of fertilizer N leaches into the ground after application—soil type, precipitation, irrigation practices, and depth to groundwater account for the wide leaching range. In the BGMA, sandy soils and shallow water tables would lead to a very high leaching rate (>35% would not be unusual). Multiplying the range of leaching rates (18% to 36%) by the average chemical fertilizer application rate (188 lbs N/ac) yields the N leached from chemical fertilizer—33.8 to 67.7 lbs/ac (Table 1). If this were the only aquifer N input, it would take from 8.5 to 17 years to reach 578 lbs N.
|
Table 1. Hypothetical annual N changes in the Bazile Groundwater Management Area aquifer |
|||||||
|
Leach rate |
|
lbs N per acre per year |
Years to reach 578 lbs N4 |
||||
|
Fertilizer1 |
Irrigation2 |
Nitrogen deposition3 |
Soil organic matter |
Net N balance |
|||
|
18% |
33.8 lbs |
-54.1 lbs |
2.4 lbs |
10 lbs |
-7.9 lbs |
Not possible |
|
|
27% |
50.8 lbs |
-54.1 lbs |
3.6 lbs |
10 lbs |
10.3 lbs |
56 years |
|
|
36% |
67.7 lbs |
-54.1 lbs |
4.8 lbs |
10 lbs |
28.4 lbs |
20 years |
|
|
1N leached per acre per year = 188 lbs N per year x leach rate. 2Irrigation = (2.72 x 17 ppm N x 1.17 acre-ft [14” applied yearly in BGMA]). 3Nitrogen deposition = leach rate x 13.4 lbs N/acre (estimated from Schwede and Lear, 2014[7]). 4Years to reach 578 lbs N = 578 lbs N Net N balance. |
|||||||
Other N sources and pools
Another N input is from atmospheric N deposition of nitrate-N and ammonium-N which averages 13.4 lb N/ac in the BGWM. Much of the ammonium-N originated from previous agricultural ammonia-N volatilization, and the deposition N is as susceptible to leaching as fertilizer-N.
With a mean of 14 inches/yr irrigation water applied at 17 ppm nitrate-N, 54 lb/ac N is removed from the aquifer and then credited (1:1) to reduce fertilizer-N input. However, in soils with moderate to high leaching rates, more N leaches back into aquifer than is removed. Excessive irrigation and rainfall exceeding crop water needs, increase leaching rates and even more excess N moves into the aquifer.
As mentioned earlier a substantial portion of crop N comes from soil N which can slowly leach nitrate-N even when no fertilizer-N is applied. Multi-year continuous corn studies show low, but consistent, corn yields even in plots where no fertilizer-N is applied[8], and leachate from unfertilized corn plots showed a leaching loss of 10 lb N per acre per year[9]. Under these hypothetical N inputs and exports leaching rates of >22% of 188 lb per acre of fertilizer N applied, net N balance is positive, so more N is moving into the aquifer than out of it (Table 1). How long it would have taken for 578 lbs to build up in the aquifer? Using the net N balance, it could have taken as little as 20 years to reach this point.
Legacy nitrogen
Fertilizer N use efficiency has improved over time with twice as much grain produced now per lb of fertilizer-N compared to the 1960’s when N rates were similar to now but with half as much yield. So why hasn’t the groundwater nitrate-N concentration decreased? During those less efficient years, a substantial amount of organic-N, ammonium-N, and nitrate-N built up in the soil root zone and in the vadose zone (from the roots to the aquifer surface), and it will take many years of very efficient water use, crop management, and fertilizer application to squeeze that excess legacy N from the soil ‘sponge’. This is what the Central Platte River nitrate story has shown where better N and water use practices have been in place for 30+ years[10]. Maps of aquifer nitrate-N concentrations and residual soil nitrate show a slow, but parallel decrease over many decades. Water dating data[11] from the Bazile Groundwater management shows that the N contaminated shallow aquifer is young (5 to 25 years), but even so it will take many years to decades for water now moving through the root and vadose zone to decrease in N since there is such a large N pool there.
While there are obviously many simplifications used here, there is a convincing argument that N leaching contributes N to the BGMA aquifer under the current management practices. In a future report, we plan to present a nitrogen mass balance accounting for the BGMA that estimates nitrate-N from commercial, livestock and animal production facilities.
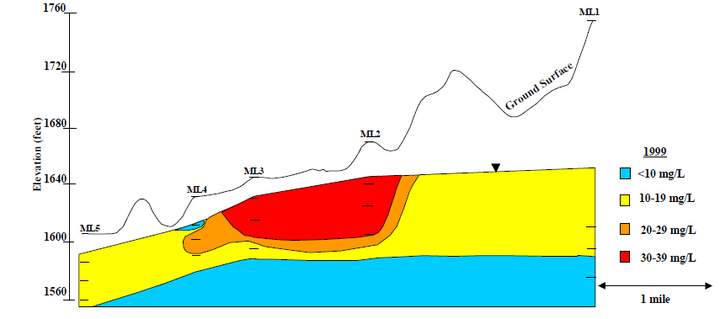
Figure 1. Vertical profile of groundwater nitrate concentrations inferred from sampling well data along a transect in the Bazile Groundwater Management Area. Inverted triangle denotes the water table and slashes indicate port depth at each well cluster (ML1 to ML5). Source: Burbach & Spalding, 2000, Evaluation and assessment of agrichemical contaminants in the Creighton NE area.
[1] Figure 22 in Bazile Groundwater Management Area Plan, 2016.
[2] Shapiro et al. 2008. Fertilizer suggestions for corn. University of Nebraska Extension paper EC117.
[3] Wortmann et al. 2011. Nitrogen use efficiency of irrigated corn for three cropping systems in Nebraska. Agronomy Journal 103:76-84.
[4] Randall & Iragavarapu. 1995. Impact of long-term tillage systems for continuous corn on nitrate leaching to tile drainage. Journal of Environmental Quality 24:360-366.
[5] Sexton et al. 1996. Optimizing nitrogen and irrigation inputs for corn based on nitrate leaching an yield on a course-textured soil. Journal of Environmental Quality 25:982-992.
[6] Masarik et al. 2014. Long-term drainage and nitrate leaching below well drained continuous corn agroecosystems and a prairie. Journal of Environmental Protection 5:240-254.
[7] Schwede and Lear. 2014. A novel hybrid approach for estimating total deposition in the United States. Atmospheric Environment 92:207-220.
[8] Wortmann et al. 2011. Nitrogen use efficiency of irrigated corn for three cropping systems in Nebraska. Agronomy Journal 103:76-84.
[9] Andraski et al. 2000. Crop management and corn nitrogen rate effects on nitrate leaching. Journal of Environmental Quality 29:1095-1103.
[10] Ferguson. 2015. Groundwater quality and nitrogen use efficiency in Nebraska’s Central Platte River Valley. Journal of Environmental Quality 44:449-459.
[11] Burbach & Spalding. 2000. Evaluation and assessment of agrichemical contaminants in the Creighton, NE area. UNL Water Center.
This article was reviewed by Charlie Wortmann, Professor of Agronomy, University of Nebraska-Lincoln Virginia Jin, USDA-ARS Research Soil Scientist